



EXCLUSIVE| PLFS 2025 Glare on Odisha’s Employment Paradox: Agrarian Districts Outperform Industrial, Service sector Hubs like Jajapur and Khordha on WPR
Key Points
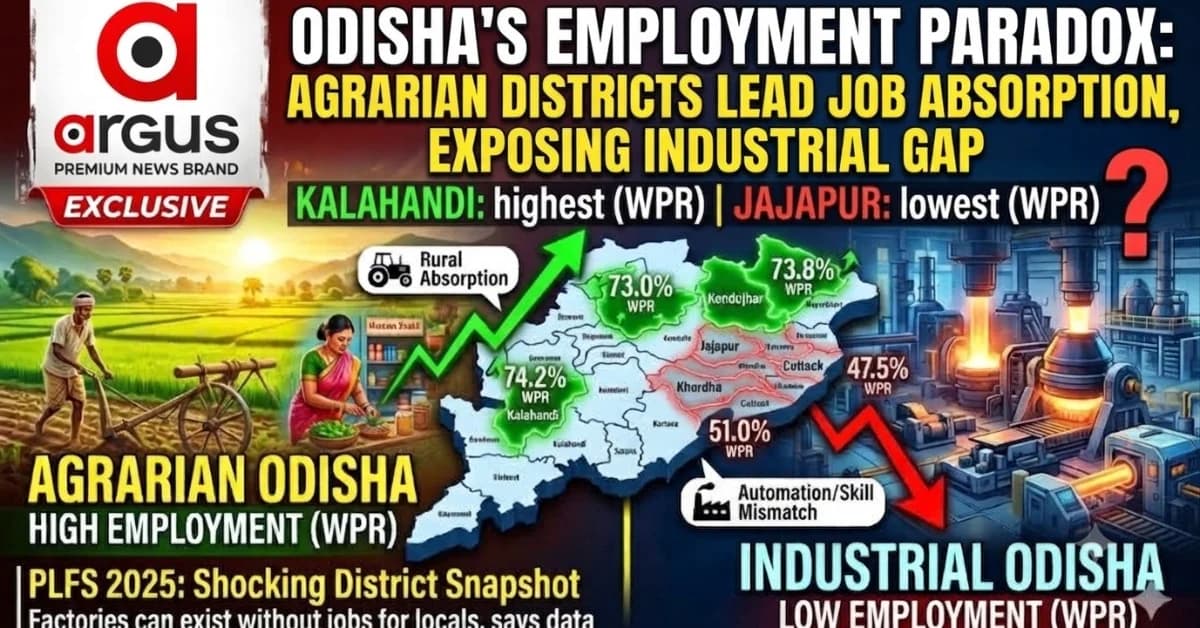
Kalahandi records Odisha's highest Worker Population Ratio (WPR) at 74.2% with a low unemployment rate of 2%, outperforming several major industrial districts.
Jajapur highlights a structural industrial mismatch, registering a low WPR of 47.5% and the highest unemployment rate at 5% despite its major industrial economy.
Primary and decentralized agricultural sectors successfully absorb a larger share of the local population into economic activities compared to capital-intensive industrial setups.
Bhubaneswar: While big headline numbers regarding the influx of industrial investments continue to dominate the state's economic landscape, a newly released district snapshot from the Periodic Labour Force Survey (PLFS) sheds light on a sustaining, much larger employment paradox in Odisha.
The dataset unveils the curtains on the state's employment story, revealing a striking divergence: the districts most associated with agriculture, mining, and primary-sector livelihoods are recording substantially higher Worker Population Ratios (WPR) and lower unemployment than some of the state's leading industrial and urban centers.
The PLFS 2025 district snapshot suggests that if employment is measured by the share of the 15+ population actually working, Odisha's strongest labour-market absorption is not necessarily concentrated in the districts with the largest industrial footprint.
Instead, districts such as Kalahandi, Kendujhar, Mayurbhanj and Balangir record WPRs above 68%, while industrial or urban-heavy districts such as Jajapur, Cuttack and Khordha show materially lower WPRs.

📱 Get Argus News App
✨The distinction is important because WPR captures whether people are working — including self-employment, casual work, agricultural labour and other forms of economic activity — rather than whether they hold a formal salaried job.
The employment map
|
District |
Broad economic character |
WPR (%) |
UR (%) |
NEET 15–29 (%) |
|---|
Kalahandi
Agriculture/primary-sector
74.2
2.0
18.0
Mayurbhanj
Agrarian/primary-sector
73.8
1.2
18.4
Kendujhar
Mining + primary/ancillary economy
73.0
1.0
16.8
Balangir
Agriculture/primary-sector
68.2
1.8
17.2
Sundargarh
Mining/industrial + primary
62.9
3.6
19.0
Baleshwar
Mixed agriculture/industrial
61.2
3.3
41.0
Cuttack
Urban/services/mixed
55.0
3.6
25.7
Ganjam
Urban/industrial/mixed
52.3
4.1
33.6
Khordha
Urban/services
51.0
4.1
26.0
Jajapur
Industrial/mineral
47.5
5.0
37.5
The underlying PLFS table identifies the indicators as LFPR, WPR and UR for people aged 15+, while NEET is separately measured for the 15–29 age group.
Kalahandi's surprising employment strength
Kalahandi provides perhaps the strongest counterpoint to the conventional assumption that industrialisation is the primary route to employment.
The district records a 74.2% WPR, the highest among the major districts in the supplied dataset, with unemployment at just 2%.
Its NEET rate is 18%.
This does not mean that Kalahandi has eliminated unemployment or that its jobs necessarily provide high incomes. Rather, the figures indicate that a large proportion of its adult population is economically engaged.
That is an important distinction.
In rural economies, employment may come from farming, agricultural labour, livestock, petty trade, self-employment and other informal activities. These forms of work are counted within labour-market indicators.
Mayurbhanj: 73.8% WPR, just 1.2% unemployment
Mayurbhanj produces another strong result.
Its WPR stands at 73.8%, while unemployment is only 1.2%. Its youth NEET rate is 18.4%.
The significance lies in the contrast.
A district does not need a dense concentration of large factories to show a high WPR. A diversified primary-sector economy can absorb labour through multiple smaller economic activities.
The employment may be distributed rather than concentrated.
This is precisely why comparing industrial output with WPR can be misleading.
Kendujhar: the mining district that also scores high on absorption
Kendujhar complicates the industrial-versus-agriculture debate even further.
The district combines mining with transport, logistics, ancillary activities and traditional economic systems. It records a 73% WPR and only 1% unemployment, while its NEET rate is just 16.8%.
That suggests the important variable may not be whether a district is “industrial” or “agricultural” in isolation.
The real question is whether the dominant economic structure absorbs local labour across multiple skill levels.
Kendujhar's mining economy can create direct employment as well as indirect opportunities in transport, logistics, services and ancillary activity. That broader ecosystem can produce a much larger labour footprint than the core industrial units alone.
Then comes the industrial paradox: Jajapur
Jajapur is the sharpest contrast.
The district has a major industrial and mineral-processing economy, but its WPR is only 47.5% and unemployment reaches 5%, the highest among the listed districts. Its NEET rate is also a high 37.5%.
This is not evidence that industry destroys employment.
It points instead to a skills-and-absorption mismatch.
Capital-intensive industries can generate large investments and production with comparatively fewer workers. Where local workers lack the technical qualifications required for specialised jobs, the industrial economy may coexist with a sizeable population outside formal employment, education or training.
The dataset explicitly identifies Jajapur's industrialisation alongside its high NEET rate as a structural mismatch.
Ganjam adds another layer
Ganjam also challenges the assumption that an economically active district must necessarily have a high WPR.
Its WPR is 52.3%, unemployment 4.1% and NEET 33.6%.
The district's urban male NEET rate is particularly striking at 44.1%, indicating that the challenge is not simply lack of rural work but the inability of urban economic centres to absorb a segment of young men.
That makes Ganjam a useful comparison with primary-sector districts.
Kalahandi's 74.2% WPR and Ganjam's 52.3% WPR represent a difference of nearly 22 percentage points.
The employment gap is visible in the table
The pattern is hard to miss: the four strongest WPR figures in the supplied district sample belong to Kalahandi, Mayurbhanj, Kendujhar and Balangir.
Balangir records 68.2% WPR and 1.8% unemployment, with a youth NEET rate of only 17.2%.
Low unemployment follows the same pattern
The WPR picture is reinforced by unemployment.
|
District |
WPR |
UR |
|---|---|---|
|
Kendujhar |
73.0% |
1.0% |
|
Mayurbhanj |
73.8% |
1.2% |
|
Balangir |
68.2% |
1.8% |
|
Kalahandi |
74.2% |
2.0% |
|
Sundargarh |
62.9% |
3.6% |
|
Baleshwar |
61.2% |
3.3% |
|
Ganjam |
52.3% |
4.1% |
|
Khordha |
51.0% |
4.1% |
|
Jajapur |
47.5% |
5.0% |
This is why the more accurate headline is not “agriculture creates better jobs than industry”.
The data does not measure wages, productivity, job security, working conditions or formal-sector employment.
What it does show is that primary-sector-heavy districts are currently absorbing a larger share of their 15+ populations into work than several industrial/urban districts in the sample.
The real industrial lesson
The data actually points towards a more nuanced development question.
Odisha has invested heavily in industrialisation. But industrial investment and employment absorption are not synonymous.
A steel plant, refinery, mineral-processing complex or industrial park can produce enormous economic value while employing a relatively small workforce compared with the size of the surrounding population.
Agriculture operates differently.
It is labour-intensive and geographically distributed. A farmer, farm labourer, transporter, trader, livestock worker or small self-employed operator can all be counted as economically active.
This partly explains why a district such as Kalahandi can post a higher WPR than an industrial district such as Jajapur.
But there is a caveat Odisha cannot ignore
High WPR is not automatically a sign of high-quality employment.
A district may record a strong WPR because people cannot afford to remain outside work and therefore participate in low-productivity informal or agricultural activities.
Similarly, a low unemployment rate does not necessarily mean that workers have good wages or stable jobs.
This is why the PLFS numbers should be read as a labour absorption map, not a prosperity ranking.
The state-level picture itself is relatively strong: Odisha's WPR is 61.3%, LFPR 63.2% and unemployment 2.9%.
But the district-level divergence is the bigger story.
What Odisha's employment strategy needs to learn
The figures suggest three different models.
First, primary-sector absorption: Kalahandi, Mayurbhanj and Balangir demonstrate how agriculture and decentralised economic activity can keep a large share of the population economically engaged.
Second, resource-linked absorption: Kendujhar shows how mining can have a broader employment footprint when connected to transport, logistics and ancillary activities.
Third, capital-intensive industrialisation: Jajapur demonstrates that major industrial activity does not automatically translate into high local WPR.
The policy challenge, therefore, is not to choose agriculture over industry.
It is to make industrial growth labour-inclusive, while simultaneously modernising the primary sector so that high WPR does not simply mean low-productivity survival work.
The big employment takeaway
The headline emerging from the PLFS 2025 district numbers is therefore counter-intuitive:
Odisha's highest employment absorption is showing up not in all its industrial hubs, but in several districts where agriculture, mining and distributed primary-sector activity remain central to the local economy.
Kalahandi's 74.2% WPR, Mayurbhanj's 73.8%, Kendujhar's 73% and Balangir's 68.2% stand well above Jajapur's 47.5%.
The lesson is not that factories do not create employment.
It is that the employment footprint of an economy depends on how deeply its dominant sectors connect with the local labour force.
For
Odisha's next phase of development, that may be the more
consequential question: not simply how much investment a district
attracts, but how
many of its people actually find a place in the economic system
created around that investment.
Also Read: EXCLUSIVE| PLFS 2025: Odisha Youth NEET Crisis unravels Vicious Circle of Male Idleness and rising Crime graph from Baleswar, Jajapur to Ganjam
Related Topics
Explore more stories