



EXCLUSIVE| Odisha Corruption Matrix: Revenue Tops Retail Bribery, Works Leads Wholesale, Forest Surges Fastest
Key Points
Odisha's corruption data divides departments into public-facing "retail tollbooths" and asset-insulating "wholesale syndicates."
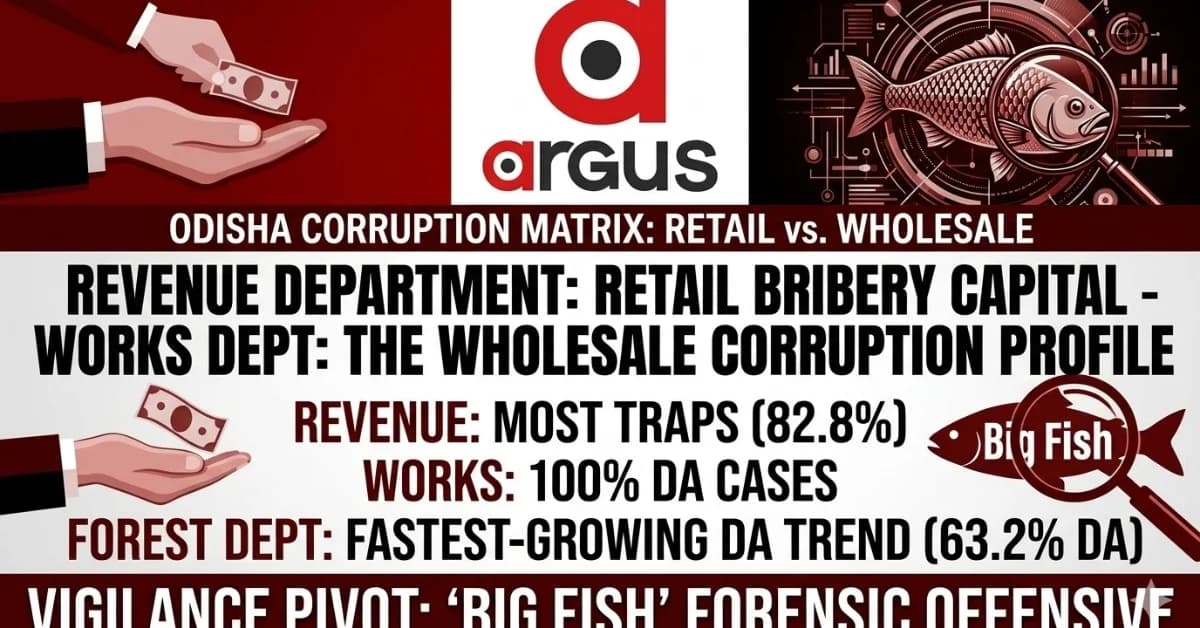
Revenue & Disaster Management leads in trap cases (82.8%), while the Works Department recorded an exclusive 100% Disproportionate Assets (DA) share.
The Forest, Environment and Climate Change Department has witnessed the sharpest historical increase in asset-related investigations.
Bhubaneswar: Odisha’s corruption landscape is revealing a striking divide between everyday or retail bribery and the accumulation of disproportionate assets or say wholesale corrpution, with the data tabled in the State Assembly by CM Mohan Majhi pointing to distinct patterns across government departments.
While the Revenue and Disaster Management Department accounts for the highest number of trap cases, the Works Department stands out for recording only disproportionate assets (DA) cases, and the Forest, Environment and Climate Change Department has witnessed the fastest rise in asset-related investigations.
An analysis of 370 cases involving government employees during the June 2024–September 2026 period, comprising 240 trap cases and 130 DA cases, reveals how the nature of corruption detected by Odisha Vigilance differs across departments.
The data reveals a profound structural truth: corruption in the state is no longer a monolith. The data exposes a stark divide within the bureaucratic machinery, separating departments into

📱 Get Argus News App
✨"retail tollbooths" driven by immediate cash handovers, and
"wholesale syndicates" optimized for multi-million asset insulation.
Furthermore, this structural shift also directly mirrors a changing of the guard at the political level. The transition from the 24-year tenure of Naveen Patnaik to the Mohan Charan Majhi administration has accelerated a deliberate operational strategy: the DA data shows moving away from low-level street stings and unleashing an aggressive forensic offensive against top-tier bureaucracy – the "Big Fish."
Revenue Department: The Retail Bribery Capital
The Revenue and Disaster Management Department tops the departmental matrix with 72 trap cases, the highest among the five departments examined. Against 15 DA cases, traps account for 82.8% of its 87 cases, while DA investigations constitute just 17.2%.
Revenue & Disaster Management
Trap cases
72 (82.8%)
DA cases
15 (17.2%)
Total: 87 cases
The department’s high trap count reflects the extensive interface between revenue officials and citizens. Land records, mutation, certificates, registration-related processes and other administrative services bring people into frequent contact with field-level officials. These interactions create multiple points at which alleged demands for illegal payments can arise and be detected through trap operations.
The data therefore places Revenue at the centre of what may be described as retail corruption – a pattern of repeated, individual transactions involving public-facing services. However, the relatively lower share of DA cases does not establish that the amounts involved are necessarily small or that wealth accumulation is absent. It shows that, within the cases recorded in this dataset, direct bribery accounts for a substantially larger share of vigilance action.
The distinction also highlights the everyday cost of corruption. Even when individual transactions involve relatively modest sums, repeated demands for illegal payments can affect access to essential government services, particularly for citizens who depend on local administrative offices for land and livelihood-related documentation.
Works Department: The Wholesale Corruption Profile
At the other end of the spectrum, the Works Department presents a markedly different pattern. The department, which handles major infrastructure projects, roads, buildings and engineering works, recorded nine DA cases and no trap cases in the period under review. All nine cases, therefore, fall under the DA category.
Works Department
Trap cases
0 (0%)
DA cases
9 (100%)
Total: 9 cases
This 100% DA share makes Works the most distinctive department in the matrix. Unlike Revenue, where the vigilance record is dominated by alleged direct bribe-taking, the cases recorded against Works officials in the dataset relate entirely to suspected disproportionate wealth.
The department’s exposure to large public infrastructure budgets, tendering and contract execution offers a different set of potential corruption risks. Alleged irregularities may involve project costs, contract awards, bill clearances, procurement and the diversion of public funds. Such activities can require examination of financial records, property ownership, banking transactions and the assets accumulated by officials over time.
The transition towards electronic procurement and digitised financial processes may also have changed the opportunities for direct, physical bribe-taking.
However, the absence of trap cases in the period does not, by itself, prove that digitisation eliminated transactional bribery or that all corruption has shifted to asset accumulation.
The historical figures chosen for the analysis show that Works recorded an average of approximately 4.2 DA cases annually during 2012–2016, rising to around 6.1 during 2017–2021.
In the current phase, nine cases over approximately 27 months translate to about 4.1 cases annually.
This indicates that the current DA registration rate is broadly comparable to the earlier periods, despite the striking 100% DA share in the latest departmental breakdown.
The central finding, therefore, is not necessarily a surge in the frequency of corruption cases in Works, but a marked difference in the type of cases registered during the latest period. The data raises questions about how corruption risks are detected in large infrastructure projects and whether financial scrutiny is keeping pace with the complexity of public procurement.
Forest Department: The Fastest-Growing DA Trend
The Forest, Environment and Climate Change Department emerges as the fastest-growing sector in the historical DA comparison. It recorded 12 DA cases and seven trap cases, taking the total to 19. DA investigations consequently account for 63.2% of its cases, making asset-related investigations substantially more common than direct bribery cases in the dataset.
Forest, Environment & Climate Change
Trap cases
7 (36.8%)
DA cases
12 (63.2%)
Total: 19 cases
The historical trajectory makes the department particularly noteworthy. The data puts its average annual DA cases at approximately 1.4 during 2012–2016, increasing to 2.6 during the subsequent historical period of 2017–2022. In the current phase, 12 cases over approximately 27 months represent an annualised rate of around 5.5.
Fastest rise in the historical comparison
This is a substantial increase in the pace of DA case registration compared with the earlier periods. The rise brings the Forest Department into sharper focus in the corruption matrix, particularly given its role in managing forest resources, environmental oversight, clearances and public expenditure on conservation and afforestation.
The department’s regulatory and resource-management responsibilities can involve interactions with contractors, commercial operators and other agencies. These create potential vulnerabilities around permissions, enforcement and the allocation of public resources. Nevertheless, the available case figures do not identify the specific causes behind the rise in DA investigations. Any direct link to illegal logging, mining clearances or afforestation fund diversion would require case-specific evidence.
The forest sector’s changing position in the matrix is thus a signal for closer examination of financial and administrative oversight.
Water Resources: A High DA Share in a Major Infrastructure Department
The Water Resources Department occupies another important position in the wholesale corruption profile.
It recorded 15 DA cases and six trap cases, bringing the total to 21. DA cases account for 71.4% of the department’s vigilance cases, the second-highest proportion in the five-department comparison.
The department manages major irrigation and water infrastructure projects, making project expenditure, procurement, contract execution and engineering oversight important areas of public accountability.
Its DA-heavy case profile indicates that a substantial portion of the vigilance action recorded in the dataset involves suspected wealth accumulation rather than direct bribe-taking.
The historical figures show an increase in the department’s annual average DA cases from around seven during 2012–2016 to approximately 12 during 2017–2022. In the current phase, 15 cases over approximately 27 months amount to an annualised rate of about 6.8.
This represents a lower pace of DA registrations than the earlier peak, suggesting a moderation in the frequency of cases compared with the 2017–2022 period. Yet the department continues to have a high DA share, indicating the importance of examining long-term financial trails alongside conventional trap operations.
Panchayati Raj: The Overlap Between Retail and Wholesale Corruption
The Panchayati Raj and Drinking Water Department presents a combination of both corruption patterns. It recorded 31 trap cases and 19 DA cases, taking the total to 50. Its 38% DA share places it between the departments dominated by direct bribery and those where asset investigations account for the majority of vigilance cases.
The department’s position is significant because of its role in implementing rural development programmes, drinking water projects and decentralised infrastructure works. Its administrative structure creates multiple points of interaction, from local-level service delivery to the execution of larger public projects.
The 31 trap cases indicate a substantial volume of alleged direct bribery detected by vigilance operations, while the 19 DA cases point to a parallel stream of investigations into suspected disproportionate wealth.
The Department Wise Table Given Below:
Revenue & Disaster Management
Trap: 72 | DA: 15 | Total: 87
DA share: 17.2%
Works
Trap: 0 | DA: 9 | Total: 9
DA share: 100%
Water Resources
Trap: 6 | DA: 15 | Total: 21
DA share: 71.4%
Forest & Climate Change
Trap: 7 | DA: 12 | Total: 19
DA share: 63.2%
Panchayati Raj & DW
Trap: 31 | DA: 19 | Total: 50
DA share: 38.0%
Health & Family Welfare
Trap: 20 | DA: 11 | Total: 31
DA share: 35.5%
Source: Department-wise vigilance figures supplied for the June 2024–September 2026 analysis. The five principal departments in the headline comparison are Revenue, Works, Forest, Water Resources and Panchayati Raj; Health is included as an additional comparator.
The Panchayati Raj department’s position highlights why a department cannot be assessed through a single corruption indicator. Its trap count is second only to Revenue among the departments in this comparison, while its DA count is higher than those of Revenue and Works. This combination points to the need for vigilance mechanisms that address both local-level transactions and potential financial irregularities in public projects.
Health Department: A More Balanced Corruption Profile
The Health and Family Welfare Department recorded 20 trap cases and 11 DA cases, accounting for 35.5% of its 31 total cases. Its profile is comparatively balanced, although direct bribery cases remain the larger category.
Health services involve extensive public interaction, while procurement, medical equipment purchases, infrastructure development and administrative spending create separate areas of financial oversight. The figures show that vigilance action in the department involves both direct bribery allegations and suspected disproportionate asset accumulation.
The department’s position also demonstrates that the distinction between retail and wholesale corruption is not absolute. A department can face allegations involving individual transactions as well as longer-term financial irregularities. The distribution of cases provides an indication of the types of alleged misconduct detected, but further details of individual investigations would be necessary to determine the nature and scale of the underlying activities.
Here is the content reformatted into a mobile-friendly view using stacked card blocks to eliminate horizontal scrolling and ensure seamless reading on smaller screens:
The Historical Matrix: Forest's Acceleration, Works' Changing Profile
The historical comparison of DA cases provides another dimension to the departmental analysis. While the latest case distribution identifies Revenue as the leader in trap cases and Works as the only department with a 100% DA share, the annualised historical figures show that the Forest Department has undergone the sharpest increase in DA registrations.
Department Breakdown
Works
2012–16 Average: 4.2 cases/year
Historical Middle (2017–21): 6.1 cases/year
Current Annualised Rate: 4.1 cases/year
Water Resources
2012–16 Average: 7.0 cases/year
Historical Middle (2017–22): 12.0 cases/year
Current Annualised Rate: 6.8 cases/year
Forest & Climate Change
2012–16 Average: 1.4 cases/year
Historical Middle (2017–22): 2.6 cases/year
Current Annualised Rate: 5.5 cases/year
Current annualised rates are calculated from the figures for approximately 27 months, June 2024–September 2026.
The historical periods differ slightly between departments, so the figures are indicative comparisons rather than perfectly matched time-series measurements.
The figures show three different trajectories. Works has a relatively stable annualised DA registration rate in the current phase, following an increase during 2017–2021. Water Resources recorded a higher historical average during 2017–2022 than in the current phase. Forest, in contrast, has continued to rise, with its current annualised rate exceeding both historical averages.
Majhi Effect: Shift Towards Senior-Level Investigations
The departmental matrix also coincides with a reported increase in vigilance action against senior officials under the Majhi administration. Data analysis records 108 Class-I officers booked between June 12, 2024 and September 2026, compared with a historical annual average of approximately 45–60 during 2018–2023, during th earlier govt rule.
Among the senior cadres, eight are Chief Engineers, two Deputy Directors of Mines, two Divisional Forest Officers and 21 other forest officials. The data also lists one Sub-Collector, two Block Development Officers and eight Tahasildars, alongside 27 police officers.
These figures point to vigilance cases involving a range of senior administrative and technical positions. They also provide context for the high DA shares recorded in infrastructure and resource-management departments, where senior officials may hold responsibilities connected with substantial public expenditure, regulatory decisions and project execution.
The Bottom Line
Odisha’s corruption matrix presents three distinct trends.
Revenue leads in the volume of direct bribery cases, highlighting the importance of accountability in public-facing administrative services.
Works records an exclusively DA-based profile in the latest departmental breakdown, bringing the focus to the detection of suspected long-term wealth accumulation in a major infrastructure department.
Forest, meanwhile, has recorded the sharpest historical increase in the annualised pace of DA cases among the three departments.
Water Resources and Panchayati Raj reveal additional layers, with both direct bribery and asset-related investigations accounting for substantial portions of their respective case totals.
For Odisha, the central governance challenge is to address both ends of the corruption spectrum: the alleged illegal payment that can obstruct a citizen’s access to a routine public service, and the suspected diversion or accumulation of wealth associated with large public projects and valuable resources.
The
vigilance matrix offers a basis for examining these different risks.
Whether the enforcement effort is translating into lasting
institutional accountability will ultimately depend on transparent
investigations, timely prosecution, convictions where warranted,
asset recovery and reforms that reduce opportunities for corruption
in the first place.
Also Read: Special Story| Sujit Kumar Raula’s House of Cards: Inside the Controversial Career of Odisha’s Fallen Jail Chief
Related Topics
Explore more stories