



EXCLUSIVE| ASI 2024-25: “Make in Odisha” Paying off, Odisha 4th in Country in Industrial Investments; Engineers, Technicians, Managers Pay Check High
Key Points
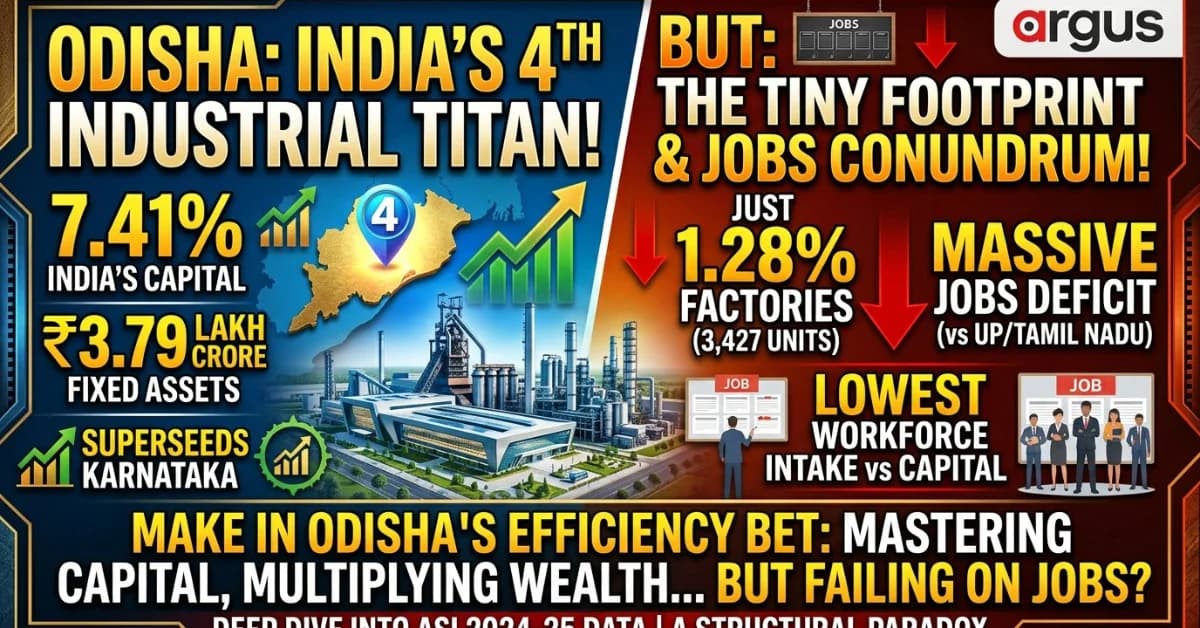
Odisha has emerged as India’s 4th-largest industrial powerhouse, capturing 7.41% of the nation’s total fixed capital.
The state boasts a superior output-to-input efficiency ratio of 1.25, outclassing neighboring resource-rich states like Chhattisgarh.
While heavy automation drives high capital wealth and premium tech salaries, it creates an ongoing employment paradox with lower mass labor absorption.
Bhuabneswar: The Annual Survey of Industries 2024-25 released on Wednesday has confirmed that the “Make in Odisha” gambit is paying off to the State.
The ASI 2025 places Odisha 4th in the country superseeding a state like Karnataka. The State sits ast fourth rank behind Gujarat, Maharashtra and Tamil Nadu.
However, a deep dive into the ASI data puts up a glare on the other side of the story. While the Make in Odisha Headline Numbers are confirmed by ASI, in the footoprint map the State still has been home to fewer industrial units. And this key indicator scripts the other side of the story for Odisha.
The big green shoot the ASI shows has been its high-profile "Make in Odisha" Conclave strategy is out to break the resource curse.

📱 Get Argus News App
✨
The ASI show how via the World-class mega-infrastructure, the State is forcing downstream manufacturing to happen locally, and cultivate a highly technical "Skilled in Odisha" workforce.
Now, check the hard mathematical proof that has arrived.
The latest Annual Survey of Industries (ASI) data offers a stunning statistical validation of this long-term economic gamble.
The figures reveal a state operating at breathtaking industrial efficiency, but they also expose a fascinating structural paradox – a gleaming, high-tech manufacturing engine that creates immense national wealth while completely rewriting the traditional relationship between capital and human labor.
The 4th Place Titan with a Tiny Footprint
The most striking revelation in the ASI data is Odisha’s emergence as India’s fourth-largest industrial powerhouse by asset volume. The state commands a staggering 7.41% of India’s total industrial Fixed Capital, locking in a massive asset base of Rs 3,78,98,277 lakh (~₹3.79 lakh crore).
What makes this fourth-place national ranking scintillating, however, is the incredibly narrow geographic footprint from which it is generated. Odisha achieved this economic dominance with just 3,427 operational factories – accounting for a minuscule 1.28% of India’s total manufacturing units.
To understand the sheer scale of this concentration, one must look at the mathematical contrast against India’s traditional industrial hubs.
Tamil Nadu leads the country with a dense web of 41,221 factories, but its average fixed investment per factory stands at roughly Rs1,057 lakh (~₹10.5 crore).
In stark contrast, the average fixed investment per factory in Odisha sits at an astronomical Rs11,058 lakh (~₹110.6 crore).
Odisha's industrial units are, on average, ten times more capital-heavy than those of Tamil Nadu.
The state has consciously rejected the pursuit of a vast, fragmented network of low-margin workshops.
Instead, its Single-Window clearances and tailored incentives have systematically engineered a concentrated playground of highly automated, multi-billion-dollar titans – exemplified by massive expansions from Tata Steel, JSW, and ArcelorMittal Nippon Steel.
Outclassing the Neighbor: The Great Efficiency Divide
Nowhere is the success of Odisha’s downstream value-addition strategy clearer than in a direct head-to-head comparison with its mineral-rich neighbor, Chhattisgarh. Historically anchored in similar resource maps of steel, power, and aluminum, the two neighbors have taken dramatically divergent paths.
Chhattisgarh operates a much larger factory network than Odisha, boasting 5,749 active units. Yet, its fixed capital asset base is less than half of Odisha's, at Rs1,35,52,281 lakh. This structural divergence reveals a massive output efficiency gap.
For every Rs100 spent on manufacturing inputs – raw materials, energy, and process logistics—Chhattisgarh's factory ecosystem amplifies that cost into Rs115.32 of total output. Odisha, however, stretches that same input into RS125.17 of output, extracting a superior 25.17% markup yield on its raw materials.
Table: Output-to-Input Efficiency Ratio (Value-Addition Yield)
|
State |
Efficiency Multiplier |
Value-Addition Yield (%) |
|
Odisha |
1.25x |
25.17% |
|
Chhattisgarh |
1.15x |
15.32% |
By transitioning away from simple mining toward complex chemical refineries, advanced metallurgical operations, and finished metals, Odisha captures a premium pricing power that its neighbor misses.
While Chhattisgarh swallows Rs 2,97,03,047 lakh in input costs to generate a Net Value Added (NVA) of Rs 36,84,957 lakh, Odisha processes a raw material volume 1.45 times larger (₹4,32,29,361 lakh) but converts it into more than double the net wealth creation, generating a staggering NVA of ₹86,65,934 lakh.
Odisha isn't just digging up wealth anymore; it is masterfully multiplying it.
The Jobs Conundrum, Salary Syndrome
This hyper-concentration of capital and technology has completely disrupted the labor market, giving rise to a highly nuanced compensation structure.
Because these modern mega-plants rely on complex, automated infrastructure rather than manual assembly lines, they require specialized talent.
Consequently, Odisha has successfully fostered a premium technical tier. The state’s average industrial emolument stands at Rs4,16,775 per person engaged, outstripping the national industrial average of Rs 3,82,451 by a comfortable 9%.
For the engineers, automation technicians, and managers operating these digital-age furnaces, the "Make in Odisha" drive delivers highly lucrative, formal livelihoods.
Yet, scratch beneath the surface of this premium payroll, and the stark structural reality of heavy industry is laid bare.
The raw Wages to Workers (the blue-collar factory floor workforce, excluding managerial staff) stands at Rs 8,94,759 lakh for 3,17,378 workers, averaging Rs2,81,922 per worker annually.
While this comfortably beats the baseline national worker wage of Rs2,28,037, it exposes a dramatic internal income chasm between white-collar technical supervisors and the frontline labor force.
Furthermore, this capital-intensive model brings with it a glaring macroeconomic challenge: the Employment Conundrum.
Table: Capital vs. Employment Paradox
|
State |
Fixed Capital Assets |
Workforce Engaged |
|
Odisha |
₹3.78 Lakh Crore |
3.81 Lakh People |
|
Uttar Pradesh |
₹3.06 Lakh Crore |
18.31 Lakh People |
Odisha’s massive Rs3.78 lakh crore fixed capital framework engages a total workforce of just 3,81,862 persons. To understand how low this labor absorption is relative to investment size, look at Uttar Pradesh. UP holds significantly less industrial fixed capital than Odisha (₹3.06 lakh crore), yet its manufacturing ecosystem engages 18.31 lakh people—nearly five times the workforce.
Metallurgical complexes and automated chemical refineries are brilliant at creating wealth, but they are structurally incapable of acting as mass employment sinks.
The Next Frontier for "Make in Odisha"
The latest ASI figures leave no room for doubt: Odisha has triumphantly won the high-stakes battle for heavy infrastructure, asset accumulation, and resource efficiency. It has successfully transformed its economy into a highly profitable, modern powerhouse that stands as a model for resource-rich regions worldwide.
Yet, the very data that celebrates this victory outlines the upcoming challenge for policy makers. Having mastered the automated, capital-heavy upstream and downstream metal sectors, the state's economic evolution requires a new chapter.
To
translate this immense capital wealth into widespread, inclusive
prosperity, the next phase of the "Make in Odisha" drive
must leverage its massive raw material advantage to aggressively
court labor-intensive industries. By feeding its locally produced
steel, specialized aluminum, and chemical inputs directly into
high-employment spin-offs – such as textile manufacturing, food
processing, industrial equipment assembly, and automotive component
plants – Odisha can begin to match its extraordinary capital
dominance with an equally powerful job-creating footprint.
Also Read: Special Report| East or West, Odisha is the Best: Massive ₹2.10 Lakh Crore Investment Secured in UAE Campaign
Related Topics
Explore more stories